


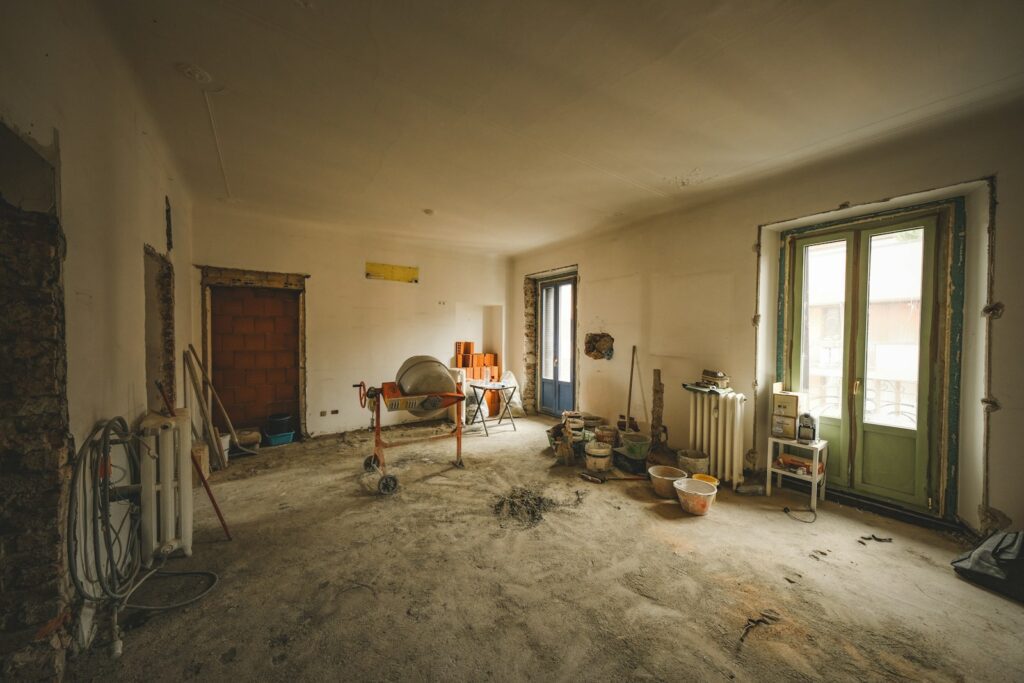
Twenty-five point four percent. That’s the average return house flippers pocketed on a renovated home in the first quarter of 2026 — the first time that number has gone up in nearly two years, according to ATTOM Data Solutions’ Q1 2026 U.S. Home Flipping Report. It followed seven consecutive quarters of shrinking margins, a stretch long enough that ATTOM CEO Rob Barber called the turnaround “a welcome sign for investors” while cautioning that the market remains “far more competitive than it was during the peak profit years.” The rebound isn’t uniform, though — in Pittsburgh, flippers are still clearing profit margins north of 85%, while in Austin, some are barely breaking even at 2%.


Here’s what’s actually behind the numbers, and what they say about where the flipping market stands heading into the back half of the year.
1. The Seven-Quarter Losing Streak Just Ended. Typical gross flipping profit hit $66,000 in Q1 2026, up from $64,300 the previous quarter, while the return on investment climbed from 24.7% to 25.4%, per ATTOM’s report. It’s the first quarter-over-quarter gain since margins began sliding roughly two years earlier. Flippers still aren’t back to where they were a year ago — Q1 2025 returns sat at 29.6% with $74,172 in typical gross profit — but the direction finally reversed instead of continuing to erode.
2. Pittsburgh Flippers Are Basically Printing Money. Among major metros, Pittsburgh posted the highest profit margin in the country at 85.9%. That kind of return points to a market where flippers are still buying well below renovated value, likely thanks to an aging housing stock and comparatively low acquisition prices relative to what a renovated home can fetch.
3. Austin Flippers Are Barely Breaking Even. At the opposite extreme, Austin’s typical flip margin sat at just 2% — a figure ATTOM’s data describes as “barely profitable.” That’s the hangover of a market where home prices ran up fast during the pandemic boom, leaving little room between what a flipper pays to acquire and renovate a property and what it actually sells for once the work is done.
4. Flippers Are Doing Fewer Deals, Not More. The rising per-deal profit came alongside a shrinking pool of flips overall — 64,348 homes were flipped in Q1 2026, representing 8% of all home sales, down from 69,711 the prior quarter and 70,579 a year earlier. Fewer investors are playing the game right now, which may itself be part of why the ones still in it are seeing slightly better margins — less competition bidding up acquisition prices.
5. Cash Still Rules the Flipping World. All-cash purchases accounted for 61.1% of flips in the quarter, while FHA-backed sales made up just 10.2%. That split underscores who’s actually still active in this segment of the market: investors and professionals with capital on hand, not first-time buyers using low-down-payment financing to try their hand at a renovation project.
6. Deals Are Taking Longer to Close. The average flip took 165 days from purchase to resale in Q1 2026, up from 160 days the previous quarter. A slower renovation-to-sale timeline usually means either more extensive work being done per project, a slower buyer pool on the resale side, or both — and it adds carrying costs that eat directly into that headline profit margin.
Put together, this isn’t a market roaring back to the frothy margins of a few years ago — it’s a smaller, more selective group of investors finding that the worst of the profit squeeze may be behind them, at least for now. Where you flip still matters more than whether you flip at all: an investor in Pittsburgh and an investor in Austin are, functionally, playing two different games with the same national headline number.
For homeowners on the other side of these transactions, the data offers a useful gut-check too. A flipped home selling in a high-margin metro like Pittsburgh likely reflects a genuine value-add renovation bought at a real discount, while a flip in a market like Austin, where margins are razor-thin, may mean the seller priced the renovation closer to what the market will actually bear rather than what a bidding war might have paid a few years ago. Either way, ATTOM’s report is a reminder that “flip” doesn’t describe one national market so much as dozens of very different local ones, each shaped by its own supply of aging housing stock, labor costs, and how much room is left between acquisition price and resale value.